 The
PDP
Debugger (Professional Debug Package,) is a group of enhancements
to the VisualWorks
debugger created by Crafted
Smalltalk. The DevTools add some additional functionality to those
changes.
The
PDP
Debugger (Professional Debug Package,) is a group of enhancements
to the VisualWorks
debugger created by Crafted
Smalltalk. The DevTools add some additional functionality to those
changes.
Aside
from the source
button
resizing and the scroll
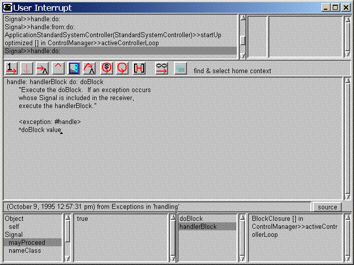
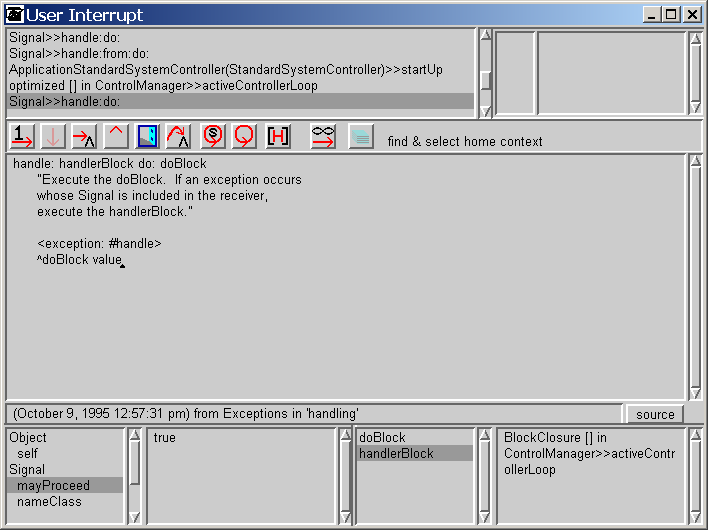
bars speed governor, the primary changes to PDP version of the
debugger are in
the Context list pane, the Text source pane, and the inspector panes.
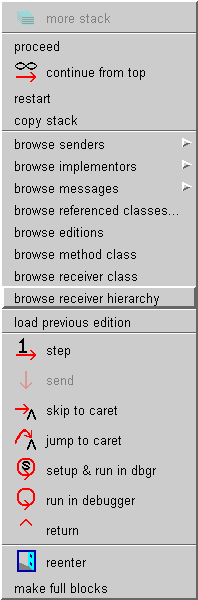
There is a new item in this pop-up menu and an added feature in the
pane.
browse
receiver hierarchy
This provides a way to open up a Class Hierarchy browser
on the class of the selected method call.
The menu item browse
receiver hierarchy on
the Context list pane pop-up menu can be removed from the menu using
code in the supplied DevTools
workspace.
See EtAbstractMethodsBrowser>>browseSelectedMethodHierarchy
and its callers
for additional
details.
double clicking on context methods
When
a selected method call in the context list pane is double clicked, a Class Hierarchy browser
will be
opened on the class of the selected method call.
This double clicking feature
can be turned on
or off using code in the supplied DevTools
workspace.
See EtAbstractMethodsBrowser>>browseSelectedMethodHierarchy
and its callers
for additional
details.
The text pane in the browser has an
enhanced pop-up menu like the one on the right.
These changes are documented in the TextEditor pop-up
menu changes.
See EtDebugger>>textMenu
and its callers
for additional
details.
In this pane, the standard Inspector
has been replaced with a SortedInspector.
For a SortedInspector in a separate window, double click on the self entry in the instance
variable list. Alternately select self,
pop up the SortedInspector’s instance pane menu, and pick the inspect sorted menu item.
See EtDebugger>>openInspectors
and its callers
for additional
details.
In this pane, the standard
ContextInspector has been replaced with a SortedContextInspector. It
works much the same as a SortedInspector
except that the sorts are alpha
and none
only. Since this
Inspector only details the variables local to the current context, the
hierarchy sort has no
meaning.
See EtDebugger>>openInspectors,
its callers and the class SortedContextInspector
for additional details.
 Context list menu and pane:
 Text pane menu:
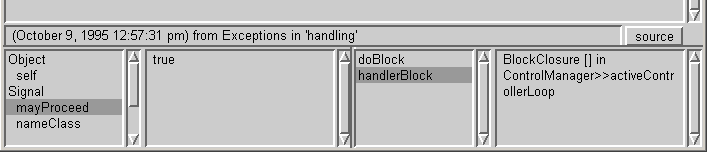 Receiver Inspector pane:
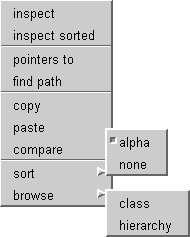 Context Inspector pane: